Welcome to the next stage of our adventure into the fascinating world of GNU Debugger (GDB) – “GDB Baby Step 4: Decoding Multiplication in Assembly with GDB”. This instalment delves deeper into the functional mechanisms of GDB, unravelling how it uncovers operations within program registers. Our focus for this exercise is to identify a specific multiplication constant utilized in a function call, only with a twist: we seek the constant in its decimal form. Ready for the challenge? Let’s dive in.
Preceding Steps: Revisiting GDB Baby Steps 1, 2 and 3
Before we take on the Baby Step 4 challenge, a quick recap of our past adventures is in order. Each step of our journey so far – from the introductory lessons of GDB, setting breakpoints, and examining registers to understand program execution flow – has been meticulously preparing us for the task.
GDB Baby Step 1 introduced us to the GDB environment and disassemble executables, Step 2 guided us on examining specific register contents at a function end, and Step 3 steered us towards understanding how memory addresses store values. All these valuable skills will come into play in Baby Step 4. If you missed the previous steps or need a refresher, revisit GDB Baby Step 1, GDB Baby Step 2, and GDB Baby Step 3.
This foundational knowledge will undoubtedly make Baby Step 4 a smoother ride.
If you are really a beginner in reverse engineering, I suggest you start with:
- Unravelling the Secrets of Reverse Engineering: Practical Applications for In-Depth Analysis
- A Beginner’s Guide to PicoCTF’s Reverse Engineering: Simple Writeups
Stepping Over vs. Stepping Into: The GDB Navigation Basics
A crucial step in our journey is to understand two fundamental GDB instructions: Step Over” (ni) and “Step Into” (si).
Both commands are about navigating through the program, but they operate differently.
- “Step Over” (ni) executes the current line of code and stops at the next one
- “Step Into” (si) digs deeper, entering into functions called by the current line of code.
In other words, ‘ni’ will treat a function call as a single operation, while ‘si’ will take you inside the function for a more detailed analysis. Both instructions are vital for efficient debugging, offering different levels of insight depending on your debugging needs.
And my idea for this article is to take advantage of it to introduce them.
Getting Ready: Preparing for the Challenge
To start off, ensure your Kali virtual machine is running smoothly, and primed for the tasks ahead. Concurrently, be logged into the picoCTF platform, ready to navigate your way through its complex structure to the reverse engineering section. Your destination lies in the ‘GDB Baby Step 4’ challenge.

The initial step is to download the file named ‘debugger0_d’ provided within the challenge. This file forms the crux of our journey, so ensure you store it in a working directory you’re comfortable with. Having this file within easy reach will streamline your tasks going forward.
With the setup in place, initiate your terminal right within this working directory. Your stage is set, your tools are prepared, and an enriching experience in the world of GDB debugging awaits you. But, before we get to the actual debugging, let’s extract some preliminary information about our ‘debugger0_d’ file.
Use the command:
file debugger0_d to reveal its nature.

This will return ‘ELF 64-bit LSB, not stripped’. This indicates that the file is a 64-bit binary executable in the ELF format and that it has not been stripped of its debugging information. This valuable insight lays the groundwork for the debugging adventure that is about to unfold.
Deciphering the Challenge: GDB Baby Step 4
Commence your dive into GDB Baby Step 4 by initiating the GDB with the following command:
gdb debugger0_dPeruse the functions in the program with our trusty command:
info functionsTake a look at the revealed functions:

Main and func1 are the functions that command our attention. The challenge description alludes to a function that multiplies the value of EAX by a constant. This might be our func1.
For a better understanding, let’s run the program and observe the difference between ‘step into’ and ‘step over’ in action.
First, change the disassembly flavour to intel with:
set disassembly-flavour intelThen, set a breakpoint on the main function with:
break mainNext, enhance the readability of the layout with:
layout asmFinally, execute the program with:
runYou’ll observe that the execution stops at the main entry point. Use the command:
niFollowed by the ‘Enter’ key (which repeats the previous command) until you reach the call instruction <main+38>.

If you ‘step over’, the debugger will bypass the call. Hence, we’ll ‘step into’ with:
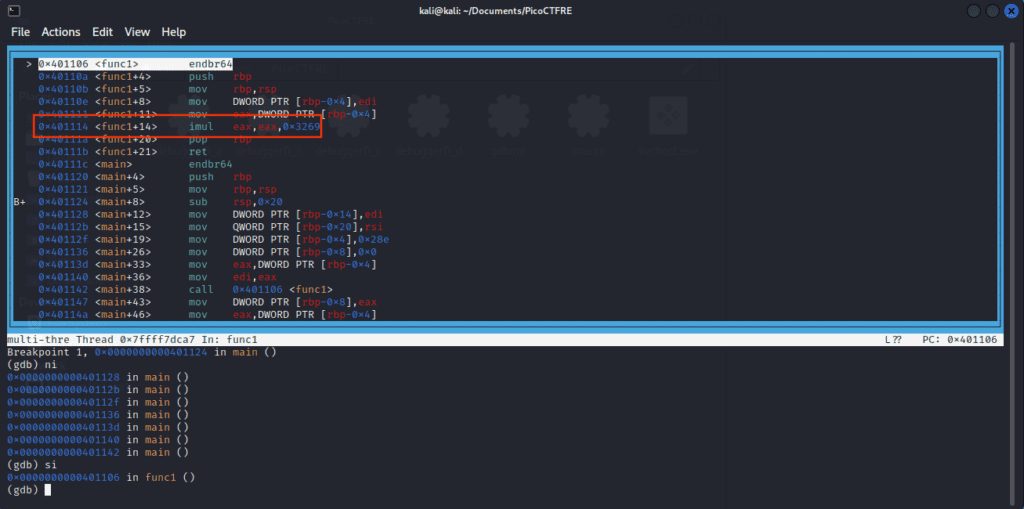
siWe find ourselves at the entry point of func1. The instruction at <func1+14> is an imul, which we’ve been on the hunt for.

The line ‘imul eax, eax, 0x3269’ implies that it multiplies EAX by 0x3269, and stores the result in EAX (first operand).
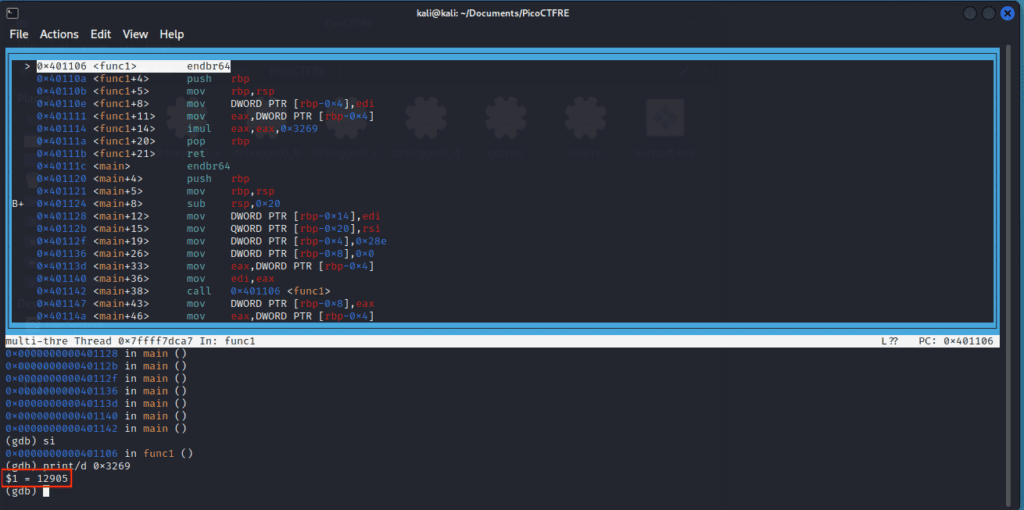
The number we’ve been searching for is indeed 0x3269. However, the description specifies it requires the decimal base of the constant. So, let’s convert it using gdb’s print command:
print/d 0x3269The conversion reveals our result: 12905

With that, we find our flag to be picoCTF{12905}.
Enter it into the input in picoCTF to complete the challenge!
Success is ours.
Conclusion
Congratulations on your successful completion of GDB Baby Step 4! You’ve delved into the depths of GDB and reverse engineering, unravelling the complexities of debugging and acquiring valuable insights along the way.
This marks a milestone in your journey but remember, there’s a vast universe of knowledge that remains unexplored. Stay curious, keep probing, and continue sharpening your skills. The path ahead promises to be more engaging and enlightening as we unravel further mysteries of GDB and reverse engineering together.
I invite you to join us for the upcoming posts on StackZero.net, where we’ll continue our journey. By following us, you’ll stay updated on the latest content and broaden your knowledge on this intriguing subject.
Also, don’t forget to follow our social media profiles. It’s a great way to stay connected, engage in enlightening discussions, and become a part of our thriving community. Your journey into the world of reverse engineering has just begun and we are thrilled to be a part of it.
Remember, every step forward, no matter how small, brings you closer to mastery. Stay tuned, and happy debugging!


